Introduction
Note: I recommend first reading the post that explains how to implement Grafana with Loki and Promtail, as this is a continuation of that post.
We have already seen how to use Grafana with Loki and Promtail for log monitoring. Now, we will explain what we need to monitor our Docker containers. Just as we needed Loki as a datasource for log monitoring, in this case, the datasource is Prometheus, which will retrieve data about the Docker containers from cAdvisor and system metrics from Node Exporter.
Files config
Therefore, we will need to add the following configuration to our docker-compose.yml file to include these three new tools (paste this configuration right below the definition of the Promtail container):
#docker-compose.yml
...
prometheus:
    image: prom/prometheus:latest
    container_name: prometheus
    user: "0"
    restart: unless-stopped
    volumes:
      - ./prometheus/config:/etc/prometheus/
      - ./prometheus/data:/prometheus
    command:
      - '--config.file=/etc/prometheus/prometheus.yml'
      - '--storage.tsdb.path=/prometheus'
    expose:
      - 9090
    ports:
      - 9090:9090
    links:
      - cadvisor:cadvisor
      - node-exporter:node-exporter

  node-exporter:
    image: quay.io/prometheus/node-exporter:latest
    container_name: node-exporter
    volumes:
      - /proc:/host/proc:ro
      - /sys:/host/sys:ro
      - /:/rootfs:ro
      - /:/host:ro,rslave
    command:
      - '--path.rootfs=/host'
      - '--path.procfs=/host/proc'
      - '--path.sysfs=/host/sys'
      - '--collector.filesystem.mount-points-exclude=^/(sys|proc|dev|host|etc)($$|/)'
      - '--collector.textfile.directory=/etc/node-exporter'
    ports:
      - 9100:9100
    restart: unless-stopped

  cadvisor:
    image: gcr.io/cadvisor/cadvisor:latest
    container_name: cadvisor
    restart: unless-stopped
    volumes:
      - /:/rootfs:ro
      - /var/run:/var/run:rw
      - /sys:/sys:ro
      - /var/lib/docker/:/var/lib/docker:ro
    expose:
      - 8080
...
Once we have our docker-compose.yml file modified to use Prometheus, cAdvisor, and Node Exporter, we will need to create the directories that Prometheus will use as volumes.
mkdir prometheus
cd prometheus
mkdir data
mkdir config
Once these directories have been created and continuing with the Prometheus configuration, navigate to the path prometheus/config/ to create its configuration file, prometheus.yml.
#prometheus.yml
# my global config
global:
  scrape_interval:     120s # By default, scrape targets every 15 seconds.
  evaluation_interval: 120s # By default, scrape targets every 15 seconds.
  # scrape_timeout is set to the global default (10s).

  # Attach these labels to any time series or alerts when communicating with
  # external systems (federation, remote storage, Alertmanager).
  external_labels:
      monitor: 'my-project'

# Load and evaluate rules in this file every 'evaluation_interval' seconds.
rule_files:
  #- 'alert.rules.yml'
  # - "first.rules"
  # - "second.rules"

# A scrape configuration containing exactly one endpoint to scrape:
# Here it's Prometheus itself.
scrape_configs:
  # The job name is added as a label `job=<job_name>` to any timeseries scraped from this config.
  - job_name: 'prometheus'

    # Override the global default and scrape targets from this job every 5 seconds.
    scrape_interval: 120s

    # metrics_path defaults to '/metrics'
    # scheme defaults to 'http'.

    static_configs:
         - targets: ['localhost:9090','cadvisor:8080','node-exporter:9100', 'nginx-exporter:9113']
Now, with everything already configured, we will proceed to start the new containers we have added to the docker-compose.yml.
sudo docker compose up -dWe can verify by running the command docker ps that we have 3 new containers running with the names prometheus, cadvisor, and node-exporter.
Web config
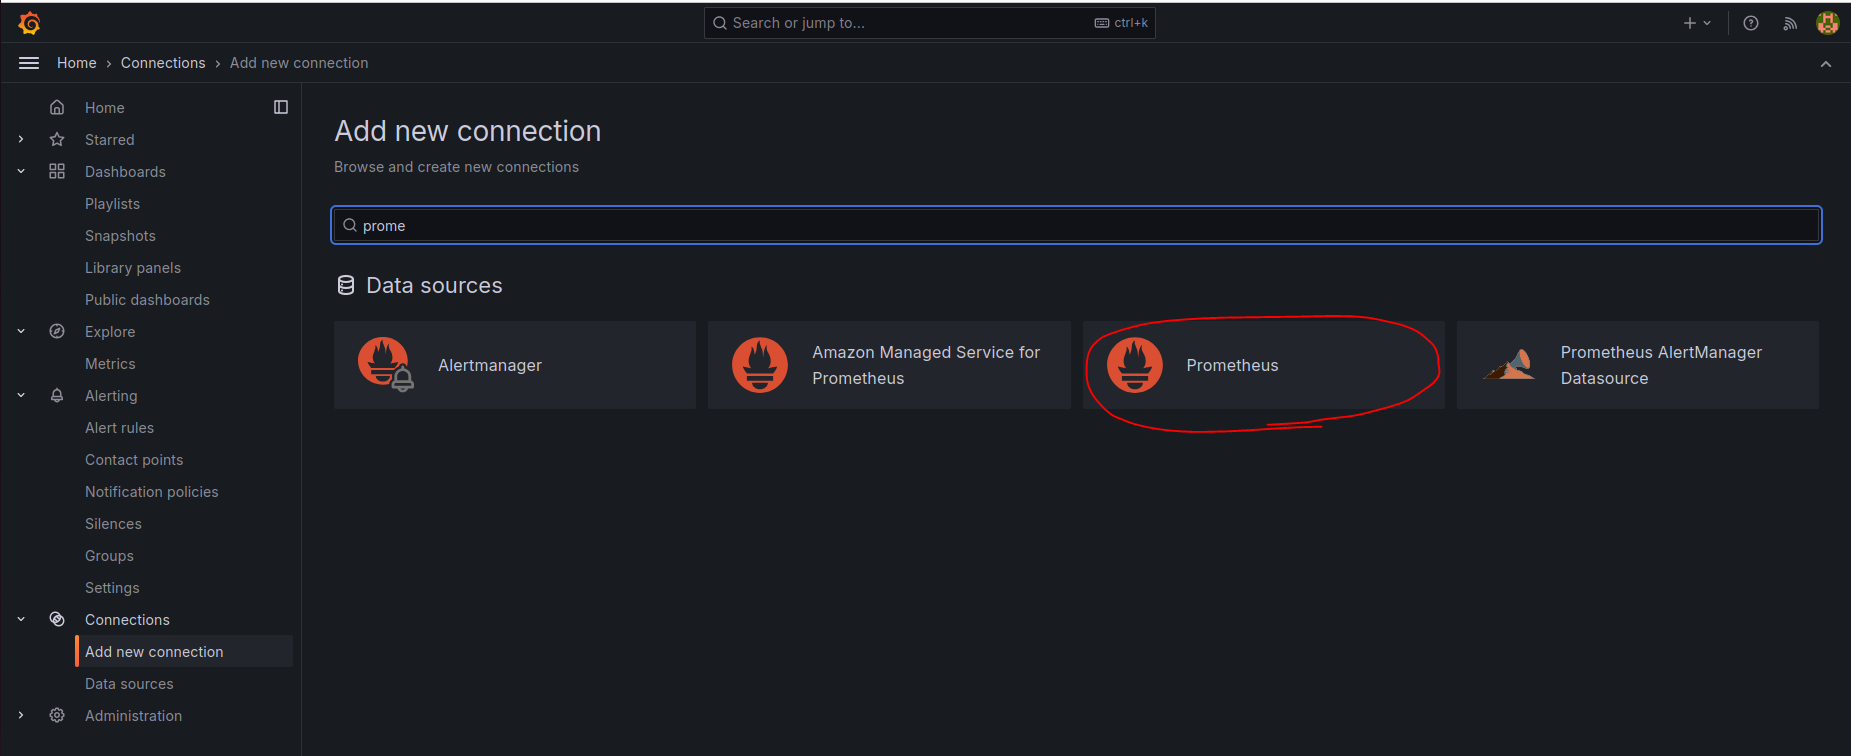
To use these containers and the data they manage, we need to access the Grafana web portal from our browser. After logging in, navigate to Connections > Add new connection, search for, and select prometheus.

Just as we did when adding the Loki datasource, we will need to specify in the Prometheus configuration its URL to fetch the data. In our case, it is http://prometheus:9090.
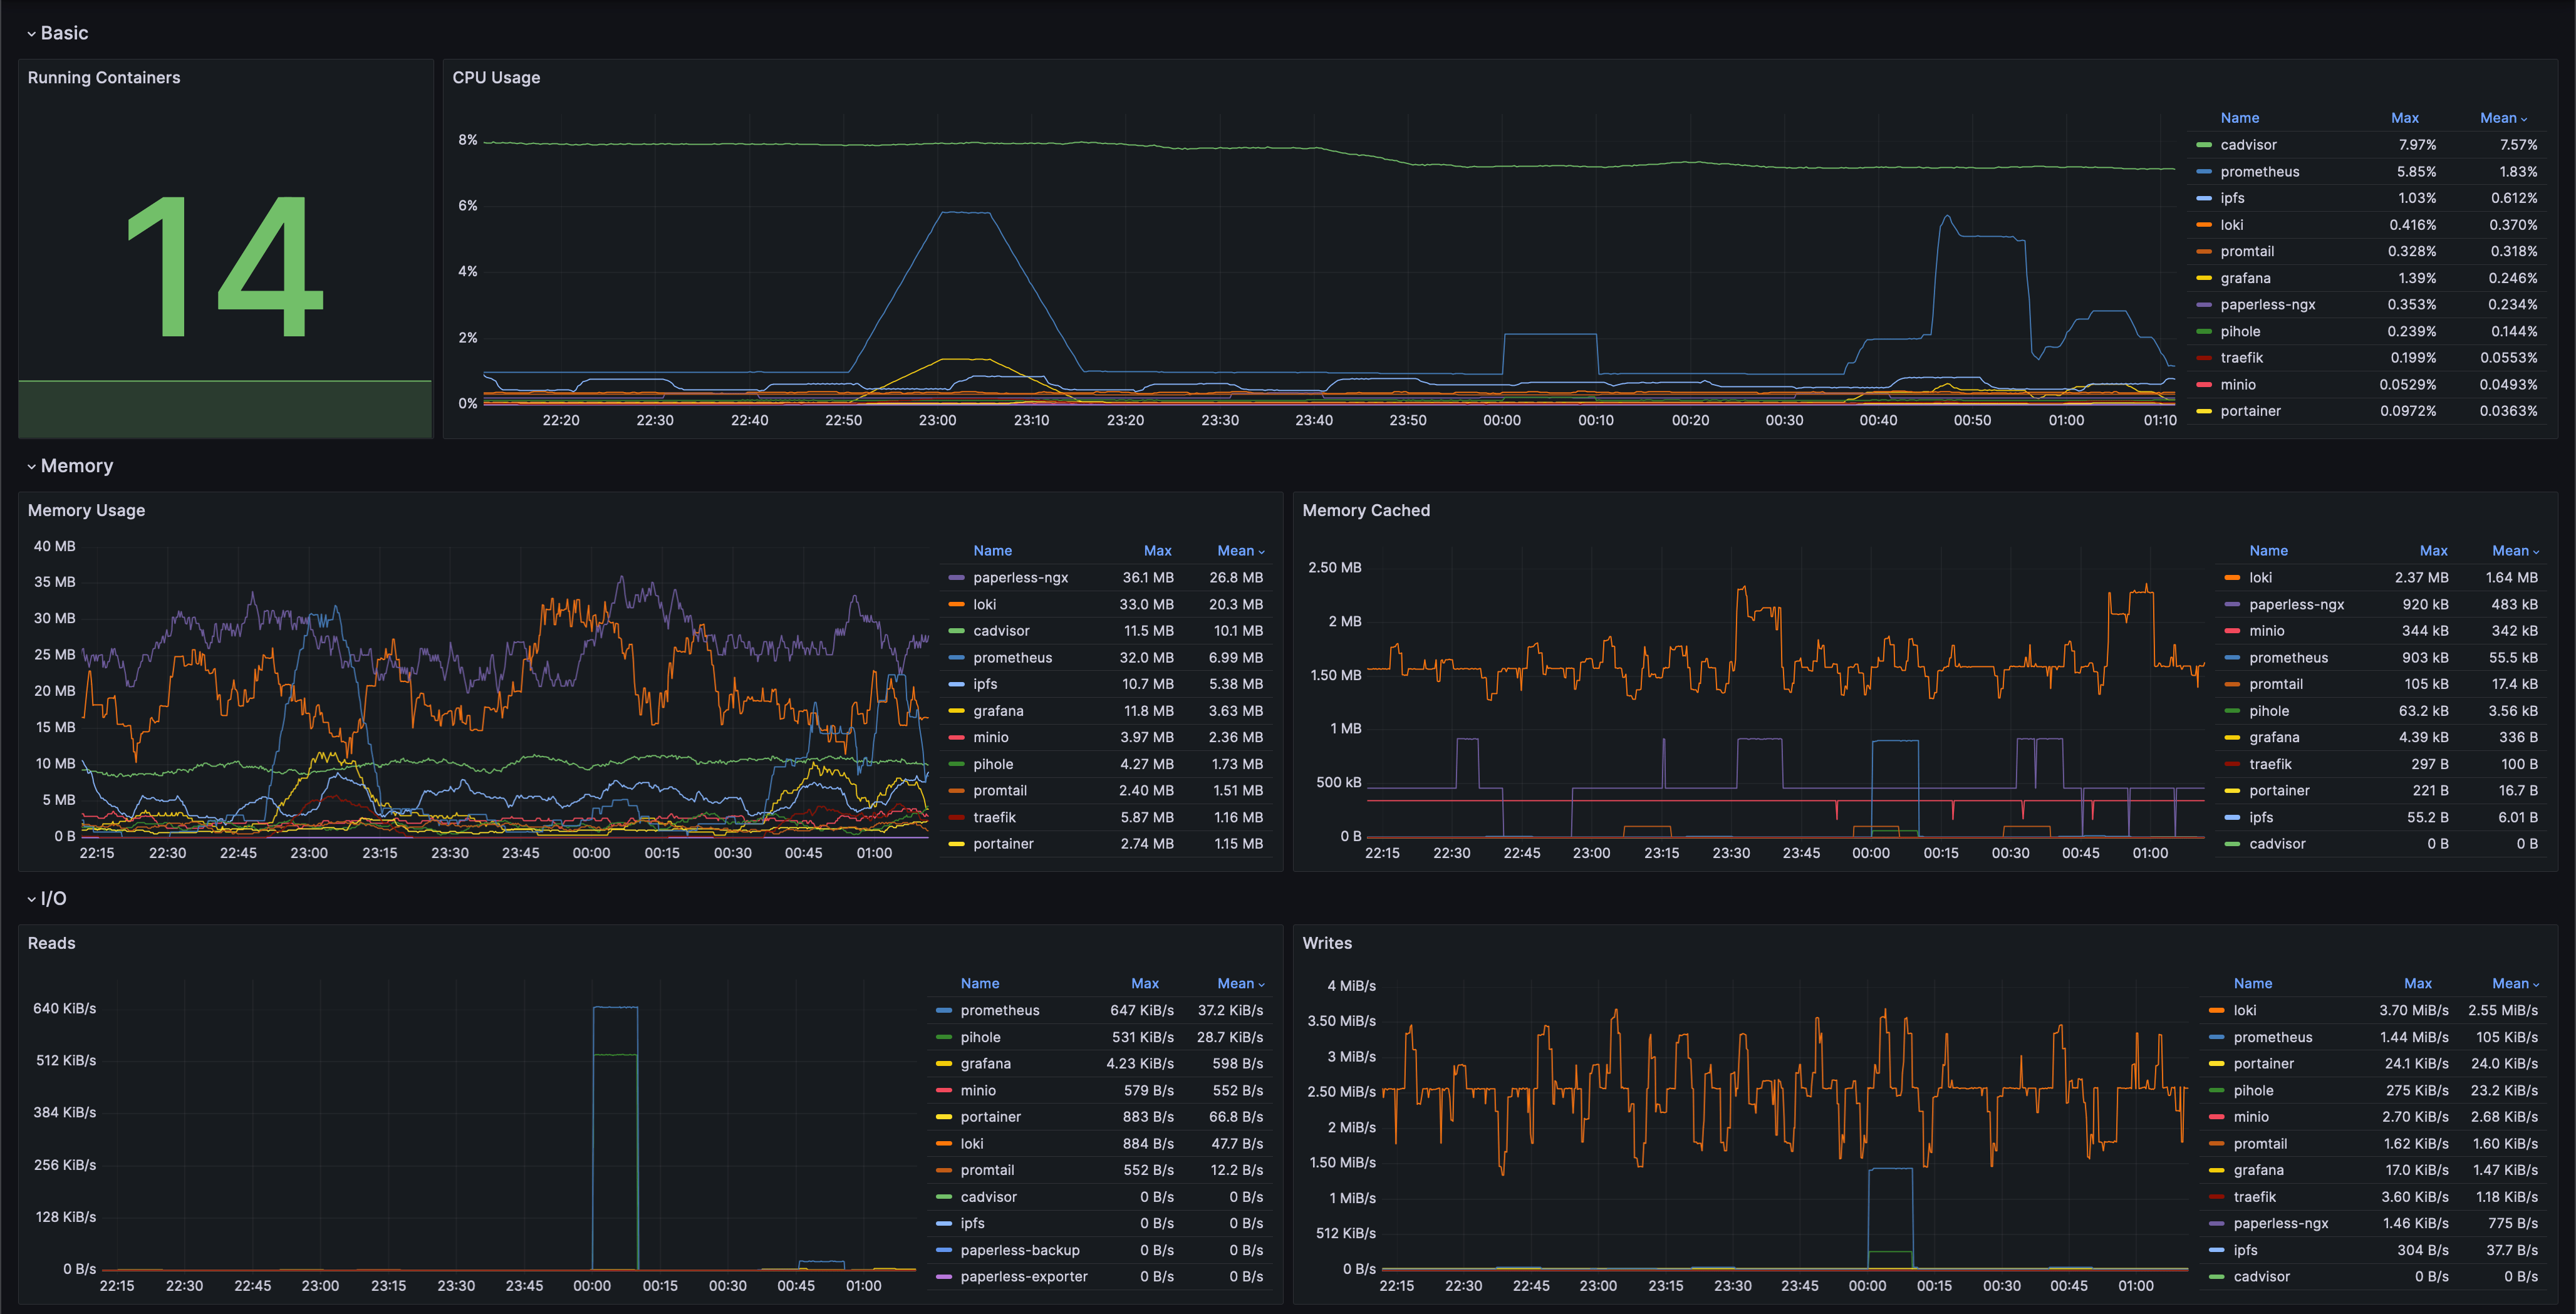
Once Prometheus has been added, we can create or import dashboards. For monitoring Docker containers, I recommend the “cAdvisor Docker Insights” dashboard: https://grafana.com/grafana/dashboards/19908-docker-container-monitoring-with-prometheus-and-cadvisor/
After adding this dashboard, you will have something like the following:

I recommend that if the “Running containers” panel shows a number that does not match the number of containers currently running, edit the panel and replace the query with the following:
count(count(container_last_seen{name=~".+"}) by (name))If you want to add system info as panels in the dasboard (Specs and System CPU/RAM), I’m providing the configuration below:
##Specs row##
#CPU Cores [type Stat] (query)
count(count(node_cpu_seconds_total{mode="system"}) by (cpu))
#Total RAM [type Stat] [unit gigabytes] (query)
node_memory_MemTotal_bytes / 1024 / 1024 / 1024
#Total SWAP [type Stat] [unit gigabytes] (query)
node_memory_SwapTotal_bytes / 1024 / 1024 / 1024
#Up time [type Stat] [unit hours] (query)
(time() - node_boot_time_seconds) / 3600

##System CPU / RAM##
#CPU usage (5min avg) [type Gauge] [unit percent (0-100)] (query)
100 * (1 - avg(rate(node_cpu_seconds_total{mode="idle"}[5m])) by (instance))
#RAM usage [type Gauge] [unit percent (0-100)] (query)
100 * (1 - (avg(node_memory_MemAvailable_bytes) by (instance) / avg(node_memory_MemTotal_bytes) by (instance)))
Finally, with this, we now have our Grafana dashboard up and running for Docker container monitoring.
