
Introduction
We will follow the flow of the Nginx logs data until it is displayed in Grafana. To begin with, in this case, we will need a custom/structured Nginx access log format. This way, we can access the data in Grafana more intuitively and in a more organized manner.
Nginx config
For this, we will need an nginx.conf with a configuration similar to this one, where we specify the structure of the access log using the log_format directive. This is necessary for the Grafana template that we are going to use to visualize the data.
# nginx.conf

user  myapp;

error_log  /var/log/myapp/error.log warn;
pid        /var/run/myapp.pid;

events {
  worker_connections  1024;
}

http {
    log_format json_analytics escape=json '{'

                            '"msec": "$msec", ' # request unixtime in seconds with a milliseconds resolution

                            '"connection": "$connection", ' # connection serial number

                            '"connection_requests": "$connection_requests", ' # number of requests made in connection

                    '"pid": "$pid", ' # process pid

                    '"request_id": "$request_id", ' # the unique request id

                    '"request_length": "$request_length", ' # request length (including headers and body)

                    '"remote_addr": "$remote_addr", ' # client IP

                    '"remote_user": "$remote_user", ' # client HTTP username

                    '"remote_port": "$remote_port", ' # client port

                    '"time_local": "$time_local", '

                    '"time_iso8601": "$time_iso8601", ' # local time in the ISO 8601 standard format

                    '"request": "$request", ' # full path no arguments if the request

                    '"request_uri": "$request_uri", ' # full path and arguments if the request

                    '"args": "$args", ' # args

                    '"status": "$status", ' # response status code

                    '"body_bytes_sent": "$body_bytes_sent", ' # the number of body bytes exclude headers sent to a client

                    '"bytes_sent": "$bytes_sent", ' # the number of bytes sent to a client

                    '"http_referer": "$http_referer", ' # HTTP referer

                    '"http_user_agent": "$http_user_agent", ' # user agent

                    '"http_x_forwarded_for": "$http_x_forwarded_for", ' # http_x_forwarded_for

                    '"http_host": "$http_host", ' # the request Host: header

                    '"server_name": "$server_name", ' # the name of the vhost serving the request

                    '"request_time": "$request_time", ' # request processing time in seconds with msec resolution

                    '"upstream": "$upstream_addr", ' # upstream backend server for proxied requests

                    '"upstream_connect_time": "$upstream_connect_time", ' # upstream handshake time incl. TLS

                    '"upstream_header_time": "$upstream_header_time", ' # time spent receiving upstream headers

                    '"upstream_response_time": "$upstream_response_time", ' # time spent receiving upstream body

                    '"upstream_response_length": "$upstream_response_length", ' # upstream response length

                    '"upstream_cache_status": "$upstream_cache_status", ' # cache HIT/MISS where applicable

                    '"ssl_protocol": "$ssl_protocol", ' # TLS protocol

                    '"ssl_cipher": "$ssl_cipher", ' # TLS cipher

                    '"scheme": "$scheme", ' # http or https

                    '"request_method": "$request_method", ' # request method

                    '"server_protocol": "$server_protocol", ' # request protocol, like HTTP/1.1 or HTTP/2.0

                    '"pipe": "$pipe", ' # "p" if request was pipelined, "." otherwise

                    '"gzip_ratio": "$gzip_ratio", '

                    '"http_cf_ray": "$http_cf_ray",'

                    '}';
    access_log /var/log/myapp/json_access.log json_analytics;

    server {
        listen 80;

        location / {
            add_header 'Access-Control-Allow-Origin' '*';
            add_header 'Access-Control-Allow-Credentials' 'true';
            add_header 'Access-Control-Allow-Methods' 'GET, POST, PUT, DELETE, OPTIONS';
            add_header 'Access-Control-Allow-Headers' 'DNT,User-Agent,X-Requested-With,If-Modified-Since,Cache-Control,Content-Type,Range';
        }
    }
}
To begin, we need to make sure that the logs of our Nginx container are persistent in a volume. For this, we specify in the docker-compose.yaml file that we will link the .logs/ directory on our host machine to the /var/log/nginx directory. Let’s assume that this docker-compose.yml file is located in the ./myapp directory. This way, we separate the application containers from the monitoring containers.
# docker-compose.yml (myapp)

version: "3.8"
services:

    #… Rest of your services

    nginx:
    image: nginx
    restart: always
    ports:
      - "8082:80"
    networks:
      - app-network
    volumes:
      - ./logs:/var/log/nginx

networks:
  app-network:
    driver: bridge
Monitoring docker-compose.yml
Next, we will create a docker-compose.yml file in which we will specify the containers needed for monitoring the logs of the Nginx container.
In this case, these will be: Promtail, Loki, and Grafana. We will create this in the ./monitoring directory (at the same level as the myapp directory). The file will look like this:
# docker-compose.yml (monitoring)

version: "3.8"

services:

  grafana:
    image: grafana/grafana-oss
    container_name: grafana
    restart: unless-stopped
    ports:
      - '4000:3000'
    volumes:
      - grafana_data:/var/lib/grafana

  loki:
    image: grafana/loki:3.0.1
    container_name: grafana-loki
    user: "0" # To force the container to use root user and avoid permission problems
    command: -config.file=/etc/loki/local-config.yaml
    volumes:
      - ./loki-config.yaml:/etc/loki/local-config.yaml
      - ./loki_data:/loki
    restart: unless-stopped
    ports:
      - "3100:3100"

  promtail:
    image: grafana/promtail:2.9.0
    container_name: promtail
    volumes:
      - ../myapp/logs:/var/log/nginx_myapp # Here we tell Promtail where the logs are
      # In case more app logs are needed
      # - ../app_name/logs:/var/log/nginx_app_name
      - ./promtail-config.yaml:/etc/promtail/config.yml
    command: -config.file=/etc/promtail/config.yml
    restart: unless-stopped

volumes:
  grafana_data: {}

networks:
  grafana:
Promtail config
Now we need to configure both Promtail and Loki. Starting with Promtail, we need to create a file called promtail-config.yaml where we will specify its behavior (this file should be located in the “monitoring” directory):
#promtail-config.yaml

server:
  http_listen_port: 9080
  grpc_listen_port: 0

positions:
  filename: /tmp/positions.yaml

clients:
  - url: http://loki:3100/loki/api/v1/push

scrape_configs:
  # myapp Config
  - job_name: nginx_myapp
    static_configs:
      - targets:
          - localhost
        labels:
          job: nginx_myapp
          __path__: /var/log/nginx_myapp/*log
    pipeline_stages:
      - json:
          expressions:
            timestamp: time_iso8601
      - timestamp:
          source: timestamp
          format: RFC3339
          action_on_failure: 'skip'

# In case more apps need to be added
#  - job_name: nginx_app-name
#    static_configs:
#      - targets:
#          - localhost
#        labels:
#          job: nginx_app-name
#          __path__: /var/log/nginx_app-name/*log
#
#    pipeline_stages:
#      - json:
#          expressions:
#            timestamp: time_iso8601
#      - timestamp:
#          source: timestamp
#          format: RFC3339
#          action_on_failure: 'skip'
Note: It’s important to highlight that the value of the job_name/labels → job property will be the one displayed in Grafana.
Loki config
Next, we move on to configuring Loki. To do this, within the “monitoring” directory, we need to create ./loki_data/, where Loki’s data will persist, because we will specify in its configuration file called loki-config.yaml (which must be located in the “monitoring” directory) that the data should persist on the local system. In this case, only data less than 7 days old (168h) should persist.
#loki-config.yaml

auth_enabled: false

server:
  http_listen_port: 3100
  grpc_listen_port: 9096

common:
  path_prefix: /loki
  ring:
    kvstore:
      store: memberlist
  replication_factor: 1

schema_config:
  configs:
    - from: "2024-01-01"
      index:
        period: 24h
        prefix: index_
      object_store: filesystem
      schema: v13
      store: tsdb

storage_config:
  tsdb_shipper:
    active_index_directory: /loki/tsdb-index
    cache_location: /loki/tsdb-cache
    cache_ttl: 168h

ingester:
  wal:
    enabled: true
    dir: /loki/wal

query_scheduler:
  max_outstanding_requests_per_tenant: 32768

querier:
  max_concurrent: 16

analytics:
  reporting_enabled: false

memberlist:
  join_members:
    - "127.0.0.1"
  abort_if_cluster_join_fails: false

limits_config:
  retention_period: 168h
  reject_old_samples: true
  reject_old_samples_max_age: 168h
  max_cache_freshness_per_query: 1m
Finally
Once we have all this set up, we just need to test by starting up the app containers by navigating to the “myapp” directory and running:
sudo docker-compose up -dThen we move to the “monitoring” directory and run the same command to start the monitoring containers.
To access Grafana, we only need to use our browser and specify the server’s IP and, in this case, port 4000 (which we specified in the docker-compose.yml file in the monitoring directory):
http://server_ip:4000/Note: The default username and password for the first Grafana login are admin.
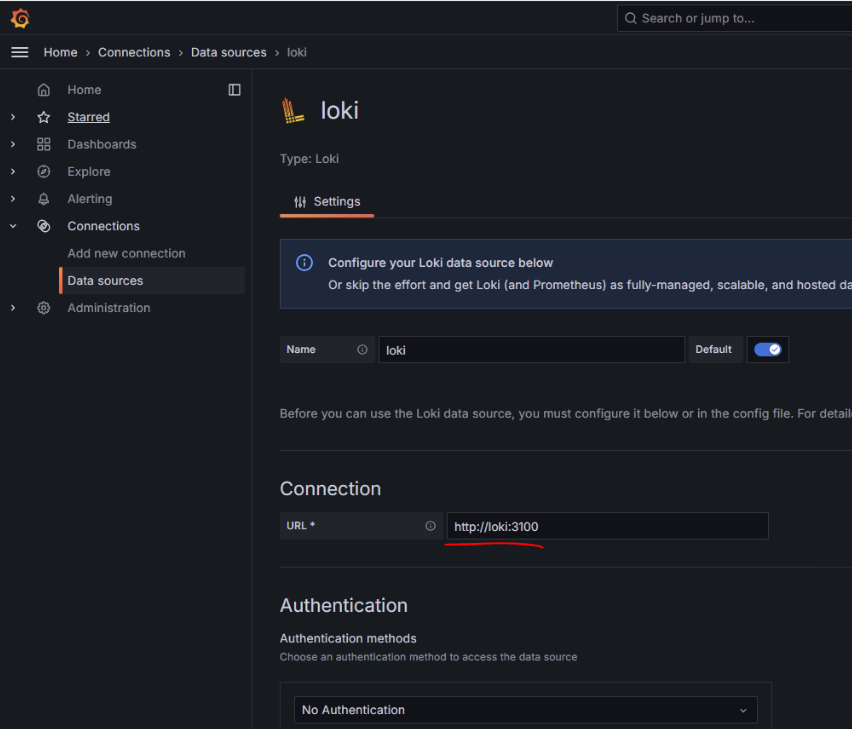
Once we are inside Grafana, we need to go to the Connections > Data sources section and add Loki as a data source, specifying the path to our Loki container (http://loki:3100)
Now that we have our data source added, we can go to the Dashboards section and create one for our app.
As a final tip, I recommend using the Grafana dashboard for log monitoring from this link: https://grafana.com/grafana/dashboards/12559-loki-nginx-service-mesh-json-version/. By accessing this link, we can copy the dashboard ID and import it from the Grafana web portal that we have deployed.